StoryMaps: Crafting Compelling Narratives with Creativity

Learning to use StoryMaps has been a fascinating journey, filled with moments of fascination and creativity. While exploring its features, I’ve been drawn to its ability to weave together maps, images, and text to craft compelling narratives. I’m eager to share this knowledge and help others harness the power of storytelling with StoryMaps.

The most interesting aspect has been its ability to visualize geographical data and historical timelines dynamically. However, I encountered some frustration when tuning layout and design elements, especially with cropping or moving an image from an image grid. Overall, my experience with StoryMaps has been rewarding, and I’m keen to continue exploring its potential.

Learning WeVideo: From Frustration to Fulfillment

Learning how to use WeVideo for video editing was extremely exciting and challenging. As I delved into the virtual platform, I found myself intrigued by its intuitive interface and the vast array of features it offers. From importing media to adding transitions and effects, WeVideo makes for a all-at-one editing experience that allowed me to bring life to my pictures. However, there were moments of frustration, particularly when trying to master more advanced techniques or troubleshooting unexpected glitches, such as adding a custom video in a WeVideo provided background template. Despite spending hours on these challenges, I was satisfied to see my project come together.

Before coming to Grinnell, I received some pictures and post of my friends about the Grinnell winter. These pictures freaked me out given that I was in the 30°C of Kolkata, India when it the temperatures were nearing -25°C! As I reflect on my experience, I feel enthusiastic about the prospect of helping others learn how to use WeVideo. Sharing knowledge and expertise in video editing can empower others to unleash their creativity and express themselves through these projects. Moving forward, I’m eager to explore more deeply the various tools and functionalities within WeVideo, such as advanced editing techniques, audio manipulation, and collaborative features!

Semester’s Progress Report and Future Plans

As the first half of the Fall Semester comes to a close, it’s an opportune moment to reflect on the road ahead in my project. Over the past few weeks, I’ve delved into a myriad of tools and resources, gaining a foundation in the web development process. Working and communicating constantly with Karen has been very helpful in shaping my vision for the website highlighting the historical ties between Grinnell College and Anatolia College.

I am have completed the list of documents shared by Karen, spanning both institutions. Furthermore, my time spent delving into the Library Archives has yielded a wealth of valuable information and pictures that will enrich the site’s content. Familiarizing myself with WordPress has proven fruitful, as it offers a robust platform for our ambitious project. Additionally, my journey into Figma and TimelineJS, in my opinion, have equipped me with the design tools I needed to present historical data in an engaging format.

Karen and I have brainstormed ideas and page structures, streamlining the content plan. Commencing the writing process for the History Tab marks the next step forward for me, setting the founding stone for the website’s narrative.

Looking ahead to the remainder of the semester, after the complete designing of the History page, I will shift my focus towards the design phase, starting with the pivotal Home Page. Simultaneously, Karen will focus on the content creation for the Alumni Story Page, adding personal narratives and interviews that capture the essence of the shared experience between the two colleges. Conducting interviews with individuals from Grinnell bound to Anatolia is a priority, as their perspectives will add depth to the Alumni Stories Tab Page, enriching the site’s human element.

One of the exciting challenges that lie ahead is the integration of basic custom JavaScript induced features, which will add interactive elements to the website, enhancing the user experience. While enthusiastic about this aspect, I am aware that it might pose some technical hurdles that will require careful navigation and problem-solving along with proper documentation.

As I contemplate the road ahead, some questions do linger, primarily concerning the balancing of aesthetics with functionality. I look forward to exploring this further in the upcoming weeks.

With a clear trajectory established, I am excited to embark on the next phase of this project, striving to create an immersive experience that highlights the rich history shared between Grinnell and Anatolia College.

Unlocking Seamless Collaboration through Effective Documentation

Having delved into the world of project documentation through this training, I’ve come to appreciate the vital role it plays in ensuring seamless collaboration and knowledge transfer within a team. This training and the real-life examples from the Documentation examples folder, in my humble opinion, have shed light on what constitutes an effective documentation. Furthermore, actively participating in creating and reviewing documentation has emphasized the significance of clarity, detail, and accessibility in this process.

For me, the key to creating a good documentation lies in its ability to serve as a comprehensive guide, providing a clear understanding of the tasks, processes, and decisions within a project. From my experience of documenting a basic task for a digital tool, I realized the importance of breaking down each step in a user-friendly manner, ensuring that even a novice can comprehend and execute the task effortlessly. Clear and precise instructions added with relevant visual aids, facilitate better comprehension and implementation.

As I embark on the journey of creating a website for my Vivero project, it has become evident to me that meticulous documentation will be pivotal for the success and continuity of the project. I will try my best to create a comprehensive documentation, outlining the project’s file naming conventions, workflows, and any customized code on WordPress for HTML/CSS/JS.

Overall, my experience with project documentation has highlighted the necessity of clear communication, attention to detail, and user-centric approach in creating effective documentation. Emphasizing these aspects will not only streamline the project workflow but also facilitate seamless knowledge transfer to the next Vivero Fellow, ensuring the project’s continued success.

Unveiling the Power of Text Analysis with Gale Digital Scholar Lab

This week, I embarked on a fascinating journey into the realm of text analysis with the Gale Digital Scholar Lab. This innovative tool opened before me the immense potential of text analysis using text mining. As I dived into the Gale Digital Scholar Lab, I was struck by the vast collection of textual resources available at my fingertips. The platform’s user-friendly interface made it relatively easy to explore and work with a wide range of texts. Despite missing the class on its usage due to my health, I found myself quickly grasping the fundamentals.

What intrigued me the most was the power of text analysis in extracting insights and patterns from vast amounts of written content. This tool allowed me to dissect texts, identify key themes, and visualize the data through the information being conveyed. I couldn’t help but think about its potential applications in my ongoing Vivero Project, which involves analyzing extensive readings.

Reflecting on my experience, I am enthusiastic about helping others to learn how to use the Gale Digital Scholar Lab. While I’m still new in using this tool, I believe that I can guide fellow learners through the initial steps and share the excitement of discovering hidden gems within texts. The prospect of collaboration and knowledge sharing is indeed exciting for me.

The most captivating aspect of text analysis for me though was watching the software unveile connections and themes within a text. It was like peeling back the layers of an onion to reveal deeper meanings and insights. However, there were moments of frustration as well like when any new tool is being learnt. I encountered some challenges in tuning my queries and interpreting the results effectively. But with practice, I believe these hurdles would be easy to overcome. I still have questions about the tool’s advanced features and its potential for more complex text analysis. I’m eager to explore how it can assist me in my Vivero Project, where I’m dealing with an extensive number of readings.

One of the key takeaways from this experience is my newfound power to utilize text analysis in my Vivero Project. With the project’s extensive readings, I now see an opportunity to streamline my research process. By applying text analysis, I can efficiently identify relevant passages, extract key information, and gain deeper insights into the history of the two institutes, Grinnell and Anatolia.

Exploring the World of Digital Mapping with ArcGIS Online

In the past week, I had the opportunity to delve into the exciting world of digital mapping using ArcGIS Online. This journey was filled with learning moments, both rewarding and challenging, as I explored this powerful mapping platform. One of the first things that struck me was the sheer diversity of data available for mapping in ArcGIS Online. From geographical data like terrain and population demographics to custom datasets, the possibilities seemed endless. I noticed that the platform made it relatively easy to import and manipulate data, which was a significant advantage in my humble opinion.

ArcGIS Online offered a variety of tools to customize the appearance of data layers. Experimenting with different drawing styles, colors, and symbols was fascinating. I learnt that these choices could significantly impact the clarity and effectiveness of my maps. It has been a crucial lesson in effective communication through data visualization. What fascinated me the most, however, was the ability to add layers of information and see how they interacted. For instance, overlaying population data with land use data provided insights into urban development patterns that I hadn’t considered before. This feature opened up a world of possibilities for analysis and decision-making.

While the platform is user-friendly overall, I did encounter some challenges. The learning curve for advanced features like spatial analysis tools was steeper than expected. Additionally, understanding the intricacies of data attribution and formatting was a bit difficult to grasp at first.

As I reflect on my experience, I’m also curious about more advanced geospatial analysis techniques and how to harness the full potential of ArcGIS Online for my Vivero project. I look forward to exploring these aspects more deeply in the future.

Journeying into Omeka

As a new fellow, my journey of learning how to use Omeka has been both informative and at times challenging. What I found most interesting about Omeka is its capacity to enable the creation of digital exhibitions and archives. It’s a powerful tool for curating and presenting collections, making it an invaluable resource for researchers and cultural institutions. Omeka’s flexibility in accommodating various media types, such as text, images, audio, and video, opens up a world of possibilities for showcasing diverse content in a visually appealing and interactive manner. This feature has been especially intriguing to me, as it allows for dynamic storytelling and engaging online exhibitions.

One of the most frustrating aspects of using Omeka for me was the initial learning curve. Setting up the platform and understanding its terminology, such as items, collections, and exhibits, required some time and patience. Additionally, troubleshooting technical issues on Omeka I feel can sometimes be tricky, especially for newcomers.

While I believe that I have made significant progress in learning how to use Omeka, there are still areas I’d like to explore more deeply. Some of the questions that remain unanswered for me are –

  1. I’m interested in delving into the customization of Omeka themes to create unique and visually appealing exhibitions that align with specific project goals.
  2. I’m curious about how Omeka can facilitate collaborative projects involving multiple contributors and editors, and how version control can be managed.
  3. Exploring how Omeka can integrate with other digital humanities and content management tools to enhance the overall user experience and functionality.

In conclusion, I am excited to continue my journey with this powerful CMS, help others along the way, and explore the various facets of Omeka that will allow me to create compelling digital archives and metadata.

Delving into the depths of Excel

In Excel, I was able to create bar charts, line charts, heatmaps, and scatterplots, which also provided me with a Pivot Table, detailing me about the charts being formed. The impact of these visualizations on my understanding of the data would depend on the research question, based on which I would be able to create visualizations with the maximum details.

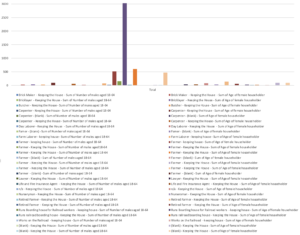
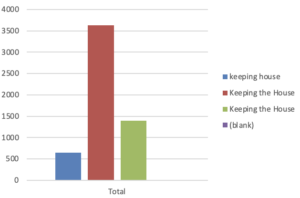
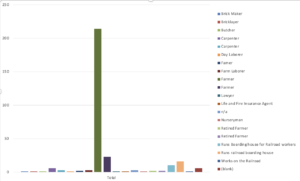
While working with various Pivot Charts in Excel to gain insights from the dataset, I encountered an interesting issue related to the occupation data for both women and men in the Grinnell Township census of 1870. Upon filtering women by their occupation, I noticed that they were grouped into three seemingly redundant categories: “keeping house,” “Keeping the House,” and “Keeping the House” once again. Similarly, when examining the occupation data for men, I observed similar errors for the occupation category ‘farmer.’

This raised a question regarding whether these anomalies were introduced by the dataset itself, perhaps due to inconsistencies in data entry or recording, or whether Excel’s data processing may have contributed to this issue. Resolving these inconsistencies would be important for accurate data analysis and visualization. The same graph for men also had similar errors for the occupations like ‘farmer’.

Additionally, data cleaning or normalization techniques could be applied to ensure that the occupation data is consistent and accurate for meaningful analysis and visualization along with the handling of missing data.

Screenshots of three graphs highlighting the occupation distribution of men, women, and families –

Learning on the Fly: My First Week as a Vivero Fellow

As a new Vivero Digital Scholarship Fellow at Grinnell, I was excited and eager to embark on this unique opportunity. However, I soon realized that this role came with an interesting twist – the expectation to learn how to do my job, quite literally, on the fly instead of learning everything in the retreat!

Prior to applying for Vivero, I had no prior exposure to the field of digital humanities. As I explored the intricacies of the role, I started to grasp the concept of its infinite nature, and I became increasingly aware of the ever-evolving landscape within the realm of digital scholarship and technology. By learning on the fly, I am better able to embrace the unknown and adapt quickly, which is incredibly valuable in my humble opinion. Moreover, taking the DST-295 course to learn what the specifics of the course requires from me, along with my fellow new Vivero Scholars has definitely helped me to get in better talking terms with them as we all share something common to start a conversation!

I feel that exploring the field of Digital Humanities as a Vivero Scholar is a journey that I’m excited to continue, and look forward to sharing my experiences and insights as I navigate the ever-evolving world of digital scholarship.

Raj’s Reflection: Vivero Retreat

I am extremely excited about learning to use WordPress and exploring the umpteen features it has to offer me with! Of the many things that I would like to add on my domain would be my journey at Grinnell: getting accepted, coming to the US, forming a community here, the student organizations, and more on how Grinnell transitioned from being my college to my home outside my home!

While exploring sites.grinnell.edu today, I was particularly surprised about the feature of having different apps to construct subdomains in my domain! This option leaves me with a good scope for exploring the scope of developing interactive websites for my peers!